How Apache Superset Powers Modern Analytics
9 min read
By Ankush Jadhav
open source
GIS
Python-Django
Introduction
Today, almost every digital system generates data.
Businesses collect customer and sales data, applications generate usage metrics, machines produce sensor data, and organizations continuously record operational information.
But collecting data is only the first step.
The real challenge is understanding that data and turning it into something useful.
This is where analytics becomes important.
Analytics helps organizations:
- Understand what is happening
- Identify trends and patterns
- Measure performance
- Detect problems and anomalies
- Compare results
- Support planning and forecasting
- Make faster, data-driven decisions
This is why modern organizations are moving from traditional reporting toward interactive analytics and data-driven decision-making.
What Is Analytics?
Analytics is the process of examining data to understand patterns, relationships, trends, and performance and then using those insights to support decisions.
A simple analytics process can be understood through four questions:
- What happened?
- Why did it happen?
- What is likely to happen next?
- What should we do about it?
For example, instead of simply knowing that sales decreased, analytics can help determine:
- Which products experienced a decline
- Which regions were affected
- When the decline started
- What factors may have contributed
- Whether the trend is likely to continue
This makes analytics much more useful than simply displaying raw numbers.
How Is Analytics Useful in Today's World?
Organizations today generate huge amounts of data.
Without analytics, this data can become difficult to understand and use.
Analytics helps organizations:
- Monitor business performance
- Track important KPIs
- Identify trends
- Compare performance across departments
- Understand customer behavior
- Detect anomalies
- Measure operational efficiency
- Improve resource utilization
- Support forecasting
- Reduce manual reporting
- Improve decision-making
Real-World Examples
Analytics can be used across almost every industry.
Retail
- Sales performance
- Product demand
- Customer behavior
- Inventory analysis
Finance
- Revenue
- Expenses
- Profitability
- Financial trends
Manufacturing
- Production performance
- Machine utilization
- Downtime
- Quality monitoring
Logistics
- Shipment tracking
- Delivery performance
- Route analysis
- Operational efficiency
Technology
- Application usage
- User behavior
- System performance
- Product analytics
Government
- Service delivery
- Project monitoring
- Resource utilization
- Public-sector KPIs
The industry may change, but the objective remains the same:
Turn data into useful information and useful information into better decisions.
From Data to Decisions
Data by itself does not necessarily provide insight.
A useful analytics process can be viewed as:
Data
↓
Information
↓
Insight
↓
Decision
↓
Outcome
Data
Raw records collected from applications, databases, sensors, transactions, or other systems.
Information
Data that has been organized, filtered, aggregated, and given context.
Insight
Patterns, trends, relationships, or anomalies discovered through analysis.
Decision
An action taken based on those insights.
Outcome
The measurable result of that decision.
This is the real purpose of analytics.
It is not just about creating charts.
It is about helping organizations understand their data and act on it.
Why Visualization Matters
Large datasets can be difficult to understand when viewed only as tables.
Visualization makes patterns easier to identify.
For example:
- A line chart can show a trend
- A bar chart can compare categories
- A pie or donut chart can show distribution
- A KPI can highlight an important number
- A map can show spatial patterns
- A heatmap can reveal concentration or relationships
This is where dashboards become useful.
A dashboard brings important metrics and visualizations together in one place so users can quickly understand what is happening.
However, a good dashboard should not simply contain many charts.
It should answer important questions.
What Is Apache Superset?
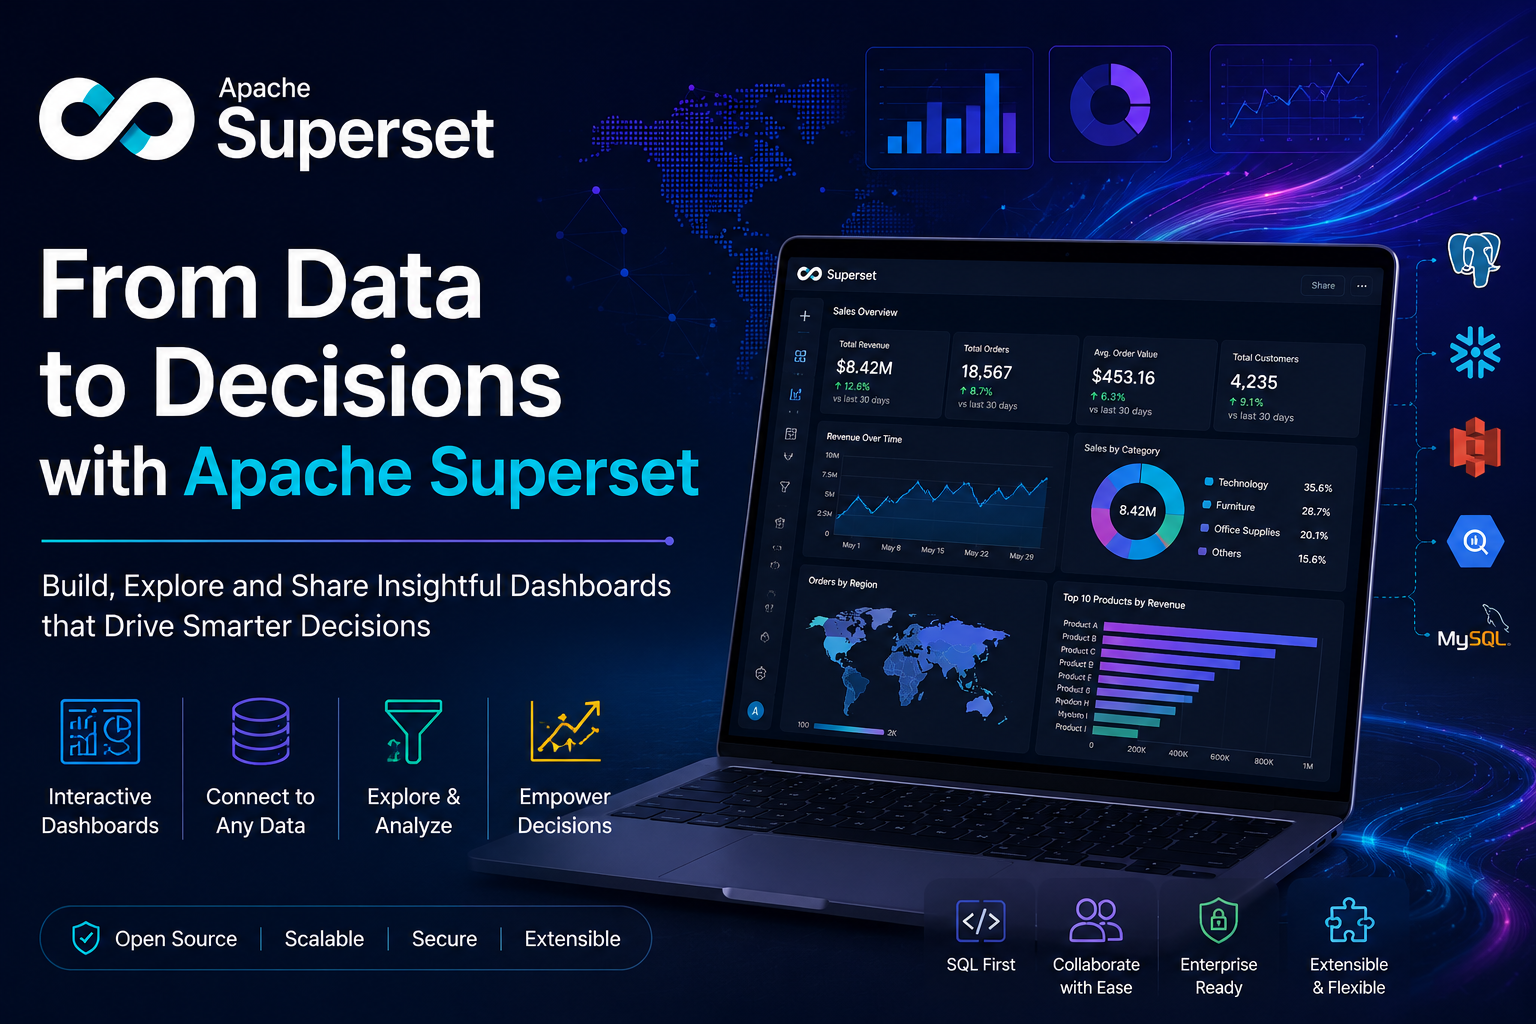
Apache Superset is an open-source data exploration and visualization platform.
It can be used to:
- Connect to databases
- Explore data using SQL
- Create charts
- Build interactive dashboards
- Define metrics
- Apply filters
- Explore trends
- Share analytics
- Embed dashboards into applications
Superset can therefore act as an analytics layer between organizational data and end users.
Why Is Apache Superset a Good Option for Analytics?
There are many analytics and BI platforms available.
Apache Superset is a strong option when an organization wants an open-source, flexible, SQL-friendly analytics platform.
1. Open Source
Superset is open source.
This provides greater flexibility around:
- Deployment
- Configuration
- Customization
- Integration
- Infrastructure
Organizations can host and manage the platform according to their requirements.
2. Works With Existing Data
Superset can connect to supported SQL-based databases and data platforms.
This means organizations can use their existing data infrastructure instead of creating a completely separate system just for dashboards.
For example:
Application
↓
PostgreSQL / MySQL / Data Warehouse
↓
Apache Superset
↓
Dashboards
3. Interactive Dashboards
Superset dashboards are not limited to static reports.
Users can:
- Apply filters
- Change time periods
- Compare categories
- Explore data
- Drill into information
- Interact with charts
This allows users to investigate the data instead of simply viewing it.
4. Customizable Dashboards
One of the biggest advantages of Superset is dashboard flexibility.
Different users can have different dashboards based on their requirements.
For example:
Management Dashboard
- KPIs
- Overall performance
- Trends
- Targets
Operations Dashboard
- Current activity
- Utilization
- Delays
- Exceptions
Sales Dashboard
- Revenue
- Customers
- Products
- Regions
Finance Dashboard
- Revenue
- Expenses
- Profitability
- Financial trends
Technology Dashboard
- Application usage
- System performance
- User activity
The same underlying data can therefore be presented differently to different users.
SQL Lab and Data Exploration
Superset is not only a dashboard-building tool.
It also provides SQL Lab, which allows technical users to:
- Write SQL queries
- Explore datasets
- Test calculations
- Analyze results
- Understand database structures
This makes Superset useful for both:
- Technical users
- Data analysts
- Business users
Technical users can use SQL when advanced analysis is required, while other users can work primarily through the visualization interface.
Semantic Layer and Reusable Metrics
Another important capability is the semantic layer.
Organizations often have important business metrics such as:
- Revenue
- Profit margin
- Conversion rate
- Utilization
- Average processing time
These metrics should have consistent definitions.
For example, if two dashboards calculate "Utilization" differently, users may get conflicting results.
A semantic layer helps define reusable metrics and calculated fields so that important analytical definitions can remain consistent.
Interactive Analytics vs Static Reports
Traditional reports are usually static.
For example:
Monthly Sales Report
--------------------
Total Sales: ₹50 Lakh
If someone wants to know:
- Sales by region
- Sales by product
- Sales by customer
- Sales by month
they may need another report.
With interactive analytics:
Total Sales
↓
Filter by Region
↓
Filter by Product
↓
View Monthly Trend
↓
Explore Detailed Data
Users can investigate the data themselves.
This reduces dependency on manually generated reports.
Embedded Analytics
Analytics does not always need to exist as a separate application.
Superset dashboards can be embedded into existing applications.
A typical architecture can look like:
User
↓
Main Application
↓
Backend
↓
Superset
↓
Dashboard
A typical flow is:
- User logs into the main application.
- Frontend requests the required dashboard.
- Backend verifies access.
- Backend obtains the appropriate Superset guest token.
- Frontend renders the dashboard.
- User interacts with analytics inside the application.
This provides a more seamless user experience.
Users do not have to switch between the application and a separate analytics portal.
Security and Access Control
Analytics can contain sensitive information.
Therefore, access control is important.
A Superset implementation can consider:
- Role-based access control
- Dashboard permissions
- Dataset permissions
- Authentication
- Authorization
- Database permissions
- Least-privilege access
- Secure production configuration
The application can also determine which dashboard a particular user should be able to access.
However, Superset should not be considered a replacement for database security.
The underlying database and infrastructure must also be secured properly.
Alerts and Scheduled Reports
Dashboards require users to open them and look at the data.
A more proactive approach is to notify users when something important happens.
For example:
Revenue < Target
↓
Condition Detected
↓
Alert
↓
Management
Superset also supports alerts and scheduled reports, depending on the configured environment.
This can help organizations move from:
"Check the dashboard."
to:
"Notify me when something requires attention."
Performance and Caching
Analytics becomes less useful if dashboards take too long to load.
Performance should therefore be considered at multiple levels.
Database Level
- Optimize SQL queries
- Create appropriate indexes
- Use efficient joins
- Avoid unnecessary data
Query Level
- Optimize aggregations
- Use appropriate filters
- Avoid unnecessarily complex queries
Dashboard Level
- Avoid too many charts
- Avoid unnecessary visualizations
- Use meaningful filters
Caching Level
Frequently requested results can be cached when the required data freshness allows it.
This can reduce repeated database queries and improve dashboard responsiveness.
Data Quality: The Foundation of Analytics
A beautiful dashboard cannot fix bad data.
If the underlying data is:
- Incorrect
- Incomplete
- Duplicated
- Inconsistent
- Poorly classified
then the resulting analytics may also be incorrect.
Therefore, analytics should include:
- Data validation
- Data cleaning
- Consistent definitions
- Null handling
- Duplicate handling
- KPI governance
- Data documentation
A simple rule is:
Good analytics starts with good data.
Self-Service Analytics
Traditional reporting often requires users to request reports from developers or data teams.
Self-service analytics changes this approach.
Users can explore available datasets and create their own visualizations without requiring a new report for every question.
However, self-service analytics should still have governance.
Organizations should control:
- Which datasets users can access
- Which metrics are official
- Which information is sensitive
- Which users can create or modify dashboards
The goal is:
More independence without losing control.
Where Does Superset Fit in the Architecture?
Superset does not need to replace the existing application or database.
It can work as an analytics layer.
Applications
↓
Operational Systems
↓
Databases / Data Warehouse
↓
SQL / Data Transformation
↓
Apache Superset
↓
Dashboards & Analytics
↓
Business Decisions
Each layer has a different responsibility.
- Applications handle workflows
- Databases store data
- Data transformation prepares analytical information
- Superset visualizes and explores the data
- Users use insights for decisions
Where Can Apache Superset Be Used?
Superset can be used across many domains.
Business Intelligence
- Management reporting
- KPI monitoring
- Performance analysis
Sales and Marketing
- Revenue analysis
- Customer analytics
- Campaign performance
Finance
- Revenue
- Expenses
- Profitability
Manufacturing
- Production
- Quality
- Equipment performance
Logistics
- Shipments
- Delivery performance
- Route analytics
Technology
- Product analytics
- Application usage
- System performance
Government
- Service delivery
- Project monitoring
- Public-sector analytics
GIS
- Spatial analytics
- Infrastructure analysis
- Asset monitoring
- Location-based insights
This makes Superset a general-purpose analytics platform, rather than a tool limited to one industry.
Benefits of Apache Superset
Faster Reporting
Reduce manual reporting work.
Interactive Analysis
Users can explore data instead of only reading static reports.
Customizable Dashboards
Dashboards can be designed according to user and business requirements.
Open Source
Organizations have greater control over deployment and customization.
SQL Support
Technical teams can perform advanced analysis using SQL.
Better Decision-Making
Important information becomes easier to understand and act upon.
Application Integration
Dashboards can be embedded into existing applications.
Scalability
Superset can be combined with appropriate database, caching, and infrastructure components as analytical requirements grow.
Challenges of Apache Superset
Superset also has some challenges.
1. Data Quality
Poor source data leads to poor analytics.
2. Dashboard Performance
Complex queries and large datasets can affect performance.
3. Security Configuration
Authentication, authorization, roles, and permissions need to be configured correctly.
4. Infrastructure
Production deployments require proper configuration, monitoring, backups, and maintenance.
5. Governance
Organizations need consistent definitions for important KPIs.
6. User Adoption
A dashboard only creates value if users actually use it in their workflow.
Best Practices for Implementing Analytics
1. Start With Business Questions
Do not start by asking:
"Which chart should we create?"
Start by asking:
"What decision should this dashboard help us make?"
2. Keep KPIs Consistent
Define important metrics once and reuse them.
3. Keep Dashboards Simple
Avoid adding charts just because they look useful.
Every visualization should have a purpose.
4. Optimize the Database
Dashboard performance depends heavily on the underlying queries and database.
5. Use Role-Based Dashboards
Different users should see the information relevant to their responsibilities.
6. Monitor Performance
Track:
- Query performance
- Dashboard loading time
- Errors
- Infrastructure health
7. Plan for Data Freshness
Decide whether the dashboard needs:
- Real-time data
- Near-real-time data
- Hourly data
- Daily data
- Historical data
Not every dashboard needs real-time data.
When Should You Consider Apache Superset?
Apache Superset can be a good choice when:
- You already have data in SQL-based databases.
- You need interactive dashboards.
- You want customizable analytics.
- You want an open-source analytics platform.
- Technical users need SQL-based exploration.
- Business users need self-service visualization.
- You want to embed analytics into an existing application.
- You need dashboards for multiple departments.
- You want to reduce manual reporting.
When Might Superset Not Be the Best Choice?
Superset may not be the ideal solution for every organization.
You should evaluate alternatives when:
- Your requirements depend heavily on proprietary BI features.
- Your organization needs a highly managed SaaS solution.
- Your team does not want to maintain infrastructure.
- Your analytical requirements are very specialized.
- The cost of operating the platform outweighs its benefits.
The right analytics platform depends on:
- Data architecture
- User requirements
- Security requirements
- Budget
- Technical capabilities
- Long-term maintenance strategy
A Practical Analytics Journey
Organizations do not need to implement everything at once.
A practical approach can be:
Step 1 → Reliable Data
↓
Step 2 → Basic KPIs
↓
Step 3 → Interactive Dashboards
↓
Step 4 → Self-Service Analytics
↓
Step 5 → Alerts & Reports
↓
Step 6 → Performance & Caching
↓
Step 7 → Embedded Analytics
↓
Step 8 → Predictive Analytics
This allows analytics capabilities to grow alongside actual business requirements.
What Makes Analytics Successful?
Technology alone does not make an analytics project successful.
A successful analytics implementation needs:
- Reliable data
- Clear business questions
- Well-defined KPIs
- Good dashboard design
- Appropriate access control
- Good performance
- User adoption
- Data governance
- Continuous improvement
The most important question should always be:
Is the analytics helping someone make a better decision?
If the answer is yes, then the analytics is providing real value.
Conclusion
Analytics has become an important part of modern organizations because data is growing rapidly and decisions increasingly depend on understanding that data.
The purpose of analytics is not simply to create charts or reports.
It is to:
- Understand what is happening
- Discover why it is happening
- Identify what may happen next
- Support better decisions
Apache Superset provides a flexible platform for achieving this through:
- Interactive dashboards
- SQL-based exploration
- Customizable visualizations
- Reusable metrics
- Data exploration
- Alerts and reports
- Caching
- Security
- Embedded analytics
Its biggest strength is flexibility.
Superset can be used as a standalone analytics platform or integrated into an existing application as an analytics layer.
Ultimately, the goal is simple:
Turn data into insight, and turn insight into better decisions.